Note
Go to the end to download the full example code or to run this example in your browser via Binder.
The distance correlation t-test of independence#
Example that shows the usage of the distance correlation t-test.
import matplotlib.pyplot as plt
import numpy as np
import pandas as pd
import scipy.stats

import dcor

# sphinx_gallery_thumbnail_number = 3
Given matching samples of two random vectors with arbitrary dimensions, the distance covariance can be used to construct an asymptotic test of independence. For a introduction to the independence tests see The distance covariance test of independence.
We can consider the same case with independent observations:
n_samples = 1000
random_state = np.random.default_rng(83110)

x = random_state.uniform(0, 1, size=n_samples)
y = random_state.normal(0, 1, size=n_samples)

plt.scatter(x, y, s=1)
plt.show()

dcor.independence.distance_correlation_t_test(x, y)
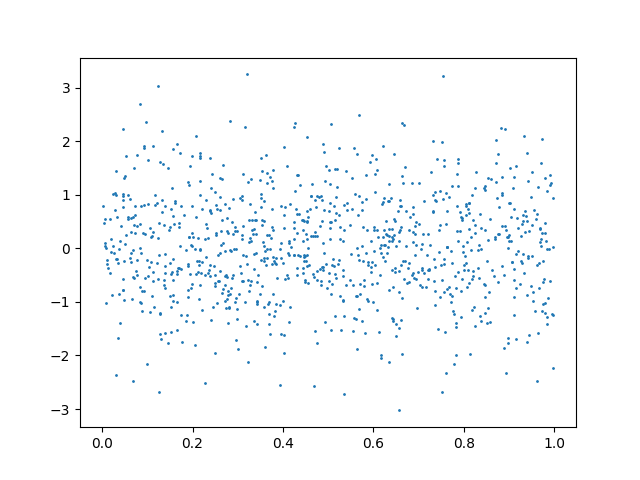
HypothesisTest(pvalue=np.float64(0.8250527908156984), statistic=np.float64(-0.934794983087892))
We can also consider the case with nonlinear dependencies:
u = random_state.uniform(-1, 1, size=n_samples)

y = (
    np.cos(u * np.pi)
    + random_state.normal(0, 0.01, size=n_samples)
)
x = (
    np.sin(u * np.pi)
    + random_state.normal(0, 0.01, size=n_samples)
)

plt.scatter(x, y, s=1)
plt.show()

dcor.independence.distance_correlation_t_test(x, y)
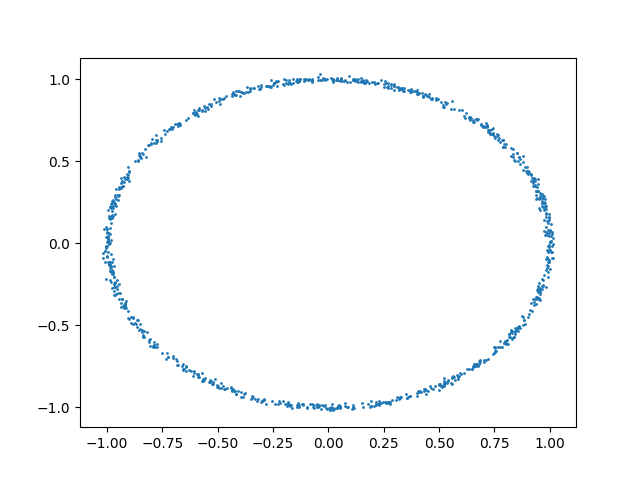
HypothesisTest(pvalue=np.float64(0.0), statistic=np.float64(29.978914739333202))
As we can observe, this test also correctly rejects the null hypothesis in the second case and not in the first case.
The test illustrated here is an asymptotic test, that relies in the approximation of the statistic distribution to the Student’s t-distribution under the null hypothesis, when the dimension of the data goes to infinity. This test is thus faster than permutation tests, as it does not require the use of permutations of the data, and it is also deterministic for a given dataset. However, the test should be applied only for high-dimensional data, at least in theory.
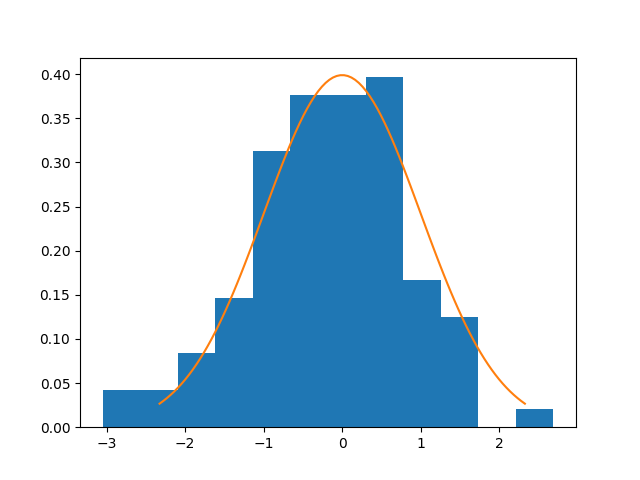
We will now plot for the case of normal distributions the histogram of the
statistic, and compute the Type I error, as seen in
Székely and Rizzo1.
Users are encouraged to download this example and increase that number to
obtain better estimates of the Type I error.
In order to replicate the original results, one should set the value of
n_tests to 1000.
n_tests = 100
dim = 30
significance = 0.1
n_obs_list = [25, 30, 35, 50, 70, 100]

table = pd.DataFrame()
table["n_obs"] = n_obs_list

dist_results = []
for n_obs in n_obs_list:
    n_errors = 0
    statistics = []
    for _ in range(n_tests):
        x = random_state.normal(0, 1, size=(n_samples, dim))
        y = random_state.normal(0, 1, size=(n_samples, dim))

        test_result = dcor.independence.distance_correlation_t_test(x, y)
        statistics.append(test_result.statistic)
        if test_result.pvalue < significance:
            n_errors += 1

    error_prob = n_errors / n_tests
    dist_results.append(error_prob)

table["Type I error"] = dist_results

# Plot the last distribution of the statistic
df = len(x) * (len(x) - 3) / 2

plt.hist(statistics, bins=12, density=True)

distribution = scipy.stats.t(df=df)
u = np.linspace(distribution.ppf(0.01), distribution.ppf(0.99), 100)
plt.plot(u, distribution.pdf(u))
plt.show()

table
Bibliography#
- 1
Gábor J. Székely and Maria L. Rizzo. The distance correlation t-test of independence in high dimension. Journal of Multivariate Analysis, 117:193–213, May 2013. URL: https://www.sciencedirect.com/science/article/pii/S0047259X13000262 (visited on 2022-05-27), doi:10.1016/j.jmva.2013.02.012.
Total running time of the script: (1 minutes 45.136 seconds)