Note
Go to the end to download the full example code or to run this example in your browser via Binder.
Usage of distance correlation#
Example that shows the usage of distance correlation.
import timeit
import traceback

import matplotlib.pyplot as plt
import numpy as np
import scipy.stats

import dcor
Distance correlation is a measure of dependence between distributions, analogous to the classical Pearson’s correlation coefficient. However, Pearson’s correlation can be 0 even when there is a nonlinear dependence, while distance correlation is 0 only for independent distributions.
As an example, consider the following data sampled from two dependent distributions:
n_samples = 1000
random_state = np.random.default_rng(123456)

x = random_state.uniform(-1, 1, size=n_samples)
y = x**2 + random_state.normal(0, 0.01, size=n_samples)

plt.scatter(x, y, s=1)
plt.show()
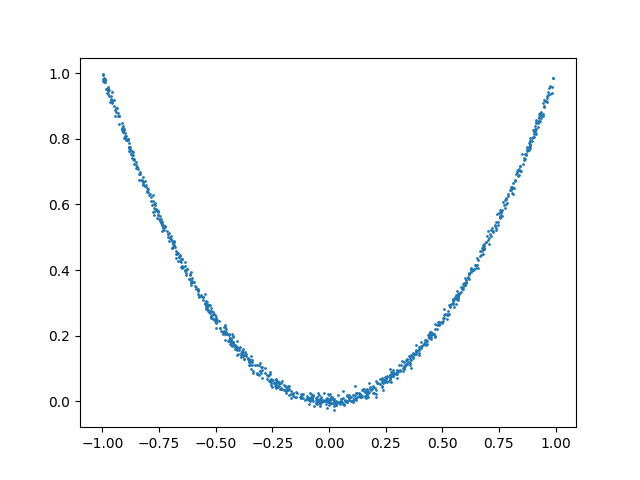
The data from the first distribution comes from a uniform distribution. However, the second distribution is a noisy function of the first one: \(y \approx x^2\). It is clear then that there is a nonlinear dependence between the distributions. The standard Pearson’s correlation coefficient is not able to detect this kind of dependence:
scipy.stats.pearsonr(x, y).statistic
np.float64(-0.04891153522218301)
Note that Pearson’s correlation takes values in \([-1, 1]\), with values near the extremes indicating a high degree of linear correlation. In this case the value is near 0, as the correlation is not linear, and thus is ignored by this method.
However, distance correlation correctly identifies the nonlinear dependence:
np.float64(0.4996764265352616)
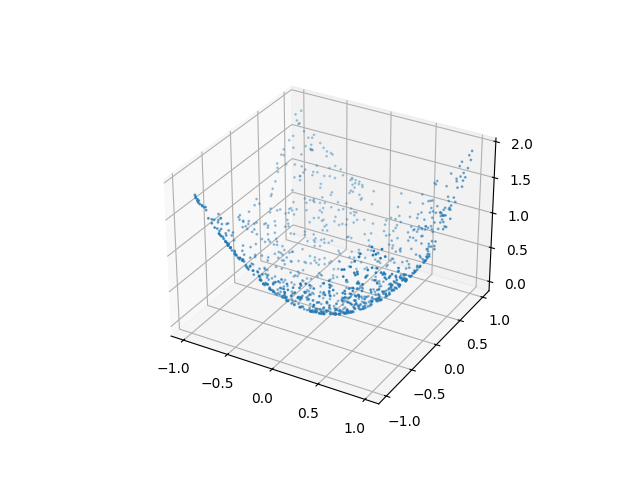
As an additional advantage distance correlation can be applied between samples of arbitrary dimensional random vectors, even with different dimensions between x and y.
n_features_x2 = 2

x2 = random_state.uniform(-1, 1, size=(n_samples, 2))
y2 = x2[:, 0]**2 + x2[:, 1]**2

print(x2.shape)
print(y2.shape)

fig = plt.figure()
ax = fig.add_subplot(projection='3d')
ax.scatter(x2[:, 0], x2[:, 1], y2, s=1)
plt.show()

dcor.distance_correlation(x2, y2)
(1000, 2)
(1000,)

np.float64(0.3612284260066458)
As with the Pearson’s correlation, distance correlation is computed from a related covariance measure, called distance covariance:
np.float64(0.1519085406311944)
The standard naive algorithm for computing distance covariance and correlation requires the computation of the distance matrices between the observations in x and between the observations in y. This has a computational cost in both time and memory of \(O(n^2)\), with \(n\) the number of observations:
n_calls = 100

timeit.timeit(
    lambda: dcor.distance_correlation(x, y, method="naive"),
    number=n_calls,
)
0.5299564619999728
When both x and y are one-dimensional, there are alternative algorithms with a computational cost of \(O(n\log(n))\), one based on the theory of the AVL balanced trees and one based on the popular sorting algorithm mergesort:
timeit.timeit(
    lambda: dcor.distance_correlation(x, y, method="avl"),
    number=n_calls,
)
0.07721003700135043
timeit.timeit(
    lambda: dcor.distance_correlation(x, y, method="mergesort"),
    number=n_calls,
)
0.03234357000110322
By default, these fast algorithms are used when possible (this is what the default value for the method, “auto”, means):
timeit.timeit(
    lambda: dcor.distance_correlation(x, y, method="auto"),
    number=n_calls,
)
0.07727701800104114
Note that explicitly trying to use the fast algorithms with multidimensional random vectors will produce an error.
try:
    dcor.distance_correlation(x2, y2, method="avl")
except Exception:
    traceback.print_exc()
Traceback (most recent call last):
  File "/home/docs/checkouts/readthedocs.org/user_builds/dcor/checkouts/latest/examples/plot_dcor_usage.py", line 129, in <module>
    dcor.distance_correlation(x2, y2, method="avl")
  File "/home/docs/checkouts/readthedocs.org/user_builds/dcor/envs/latest/lib/python3.11/site-packages/dcor/_dcor.py", line 1033, in distance_correlation
    distance_correlation_sqr(
  File "/home/docs/checkouts/readthedocs.org/user_builds/dcor/envs/latest/lib/python3.11/site-packages/dcor/_dcor.py", line 911, in distance_correlation_sqr
    return method.value.stats_sqr(
           ^^^^^^^^^^^^^^^^^^^^^^^
  File "/home/docs/checkouts/readthedocs.org/user_builds/dcor/envs/latest/lib/python3.11/site-packages/dcor/_dcor.py", line 260, in stats_sqr
    ) = self.terms(
        ^^^^^^^^^^^
  File "/home/docs/checkouts/readthedocs.org/user_builds/dcor/envs/latest/lib/python3.11/site-packages/dcor/_fast_dcov_avl.py", line 533, in _distance_covariance_sqr_terms_avl
    x, y = _transform_to_1d(x, y)
    ^^^^
  File "/home/docs/checkouts/readthedocs.org/user_builds/dcor/envs/latest/lib/python3.11/site-packages/dcor/_utils.py", line 125, in _transform_to_1d
    assert array.shape[1] == 1
           ^^^^^^^^^^^^^^^^^^^
AssertionError
Total running time of the script: (0 minutes 0.879 seconds)